
Hidden Creek Lake Flood of 2022

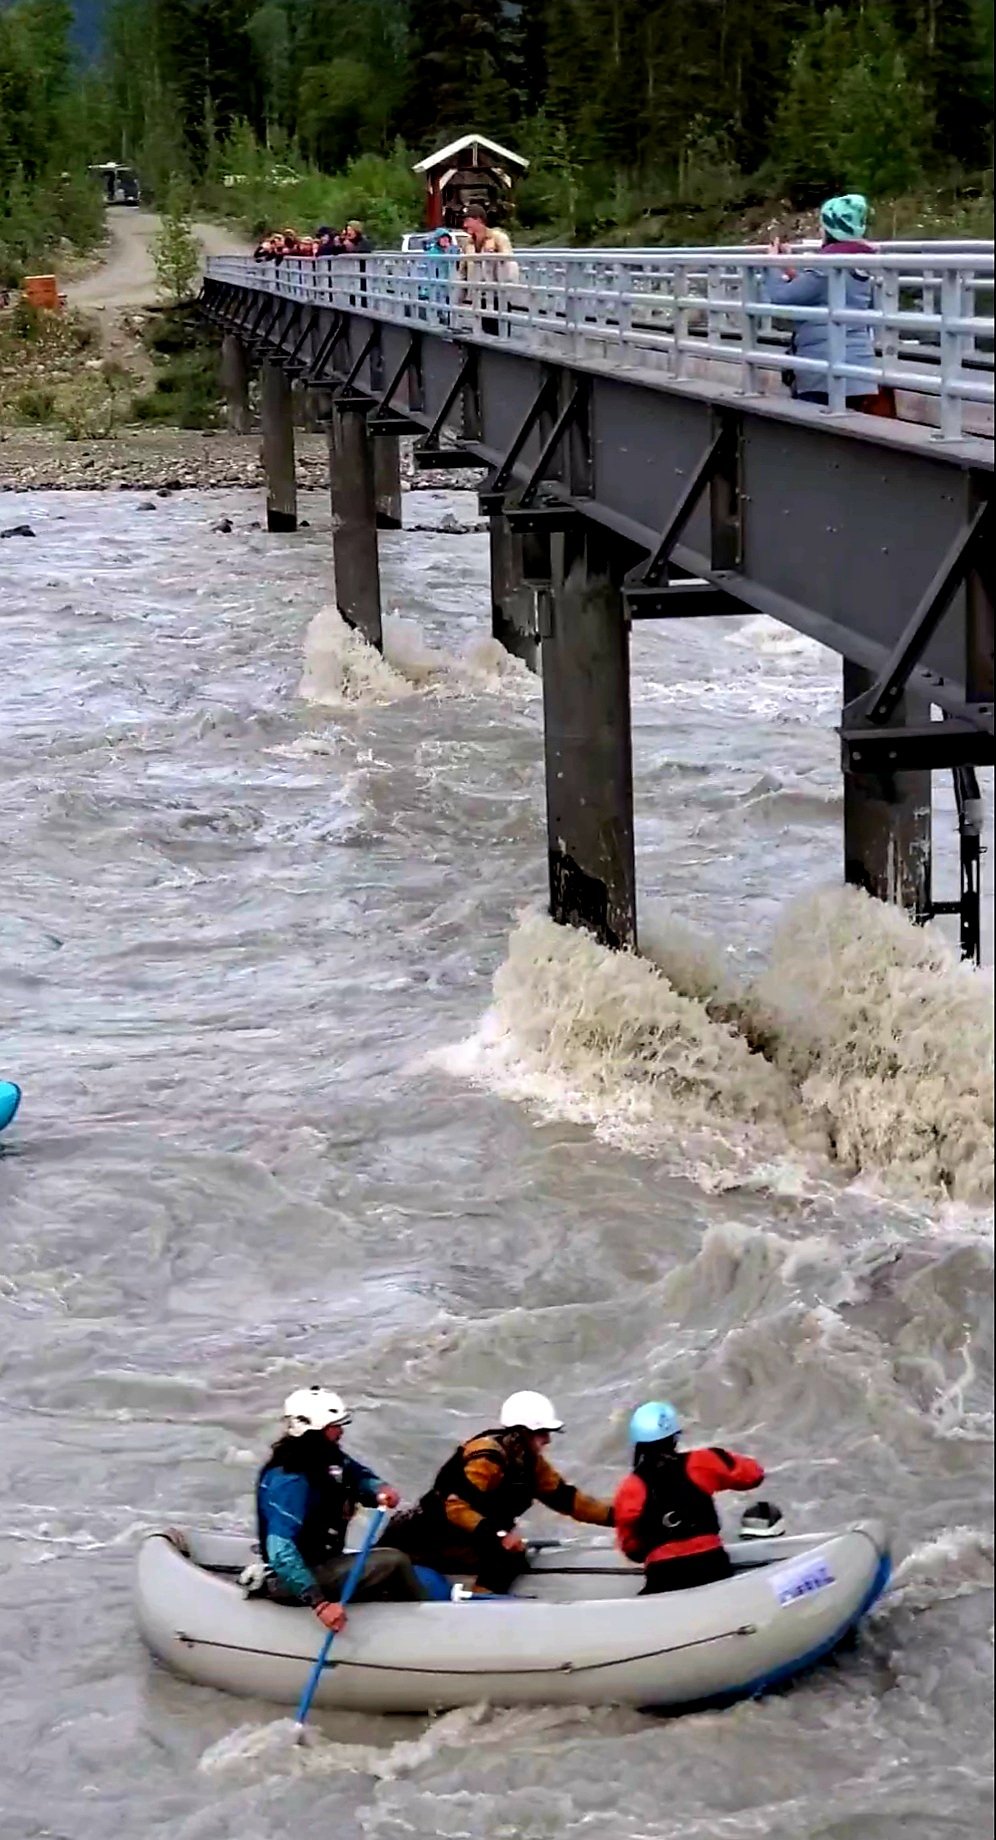
A packrafter ready to rescue an ejectee from a four person raft.
Photo by David Hollis
Hannah Rowland - CRR Staff
Early in the morning on July 13, pilots flying over Hidden Creek Lake, located on the Kennicott Glacier, saw that the lake level was starting to go down. Soon its cold, glacier water would raise the level of the Kennicott River. This is known to McCarthy as our annual jӧkulhlaup.
As defined by Wikipedia, jӧkulhlaup “is a type of glacial outburst flood.” It is a glaciological term adopted from Iceland and literally translates as “glacial run.”
Each year at the jӧkulhlaup, locals from McCarthy as well as summer employees and visitors congregate on the footbridge at the entrance to McCarthy to watch daring rafters take on the floodwaters. During many events, icebergs also come down the river, sometimes hitting the piers and shaking the bridge and those who are on it (stand on the bridge at your own risk).
McCarthy local David Hollis said, “Probably about 20 people rafted the flood twice near the peak water level on Thursday evening, July 14. On the second float, three pack rafters flipped over and one person fell out of a four person raft.”
Rafters riding the jökulhlaup, 2022.
Photo by David Hollis
He also noted there were “no icebergs this year and that it was kind of a mellow flood, but still lots of fun.”
My own memory of the past floods is fading fast while two little girls fill it with hugs, growing stages, baby dolls and learning songs. I decided to look up some data about this year’s river flow and compare this year’s jӧkulhlaup to those of past years.
The United States Geological Survey (USGS) has a measuring device on the bridge which measures both the river’s discharge and height. The data can be found on the USGS website. According to the data, this year’s flood was similar to last year’s time, depth, and discharge at its peak.

Graphic. by Hannah Rowland
Kennicott River discharge at the peak of jökulhlaups 2016-2022. For comparison, stream flow on the Kennicott River on the more average date of July 22 oscillated between 3,700 and close to 4,000 cubic feet per second. Data courtesy of USGS.
The discharge for June 16 of this year was 4,000 cubic feet per second and the gauge height was 1,341.5 ft. With more than two weeks of extreme heat in early June, the waters of the Kennicott rose later in the month. The data from USGS show the water peaked at the discharge of 7,000 cubic feet per second and a height of 1,344 ft. on June 29. Although this flood was not as big as the jӧkulhlaup, the waters remained at the higher level until the river started to go down with cooler temperatures on July 8.
In 2021, a similar rise of the river happened in late June, around June 24. The gauge height was close to 1,343 ft and the discharge was 7,000 cubic feet per second. Like this year, on about July 4 the river started to go down before the big flood hit two weeks later.
This year, the flood hit the banks of the Kennicott River on Thursday night, July 14, almost two days after the lake started letting out. The river had 14,000 cubic feet per second of discharge. The gauge height was 1,346 feet at its peak, almost two feet higher than the earlier high water in June.

2022 jökulhlaup at the footbridge on the Kennicott River.
Photo by David Hollis
In 2021, the river flooded on July 16 and the discharge was 15,000 cubic feet per second with a gauge height of 1,346 feet at its peak. The 2019 flood occurred on July 8, and was considerably larger than the past two years’ floods. The discharge was approximately 25,000 cubic feet per second and the gauge height was 1349.0 feet at its peak. For comparison, the Kennicott River height was between 1341 and 1,342 feet on July 22, 2022. This means the river was about eight feet higher at the bridge than it is now!
I looked into the data from earlier years to see if 2019 was irregular for being so early. I found that in the past seven years, the flood occurred mostly in mid-July with two exceptions: 2019, and 2016. The flood occurred closer to the end of July in 2016.
I was not able to find data for 2015 or earlier on the site. I am curious to obtain more data from past year’s USGS archives if available and see how the date and activity of the flood have changed through the past few decades.

1997 jökulhlaup at the footbridge on Kennicott River.
Photo by David Hollis
USGS water date monitoring website:
https://waterdata.usgs.gov/monitoring-location/15209700/#parameterCode=00065&period=P7D
More from Hannah Rowland: